Sport-transfer self-supervised learning — what we learned
What we learned trying to teach a vision model about sports.
A one-week investigation into whether self-supervised pretraining on in-domain video improves transfer to new sports tasks — and what those experiments taught us about how to actually measure SSL progress.
01 · What we were trying to find out
Modern vision models like Meta AI’s DINOv3 are trained on a billion+ general-purpose images and produce excellent visual features across most everyday domains. But specific sports — basketball plays, soccer events — are visually narrower: the camera positions, color palettes, and motion patterns are quite different from internet photography. So a natural question:
If you already have a strong general-purpose vision model, is it worth doing additional self-supervised pretraining on in-domain sport video? And if so, how?
We pretrained on SoccerNet (300 hours of professional soccer broadcast video) and measured transfer to two downstream tasks: basketball player segmentation on the DeepSportRadar dataset (cross-sport transfer) and soccer action recognition (in-sport). We wanted real, honest numbers and a story we could trust.
02 · Four ways to handle the pretrained model
We tested four approaches to the same downstream tasks, all evaluated with the same probing methodology so the comparison is apples-to-apples:
Reference — Frozen DINOv3. Take the pretrained foundation model and use its features as-is. This is the “do nothing extra” baseline — already very strong.
Path B — DINOv3 + lightweight adapter. Freeze DINOv3’s weights and attach a small low-rank adapter (LoRA) — roughly 0.6 M new trainable parameters out of 22 M total. We train only the adapter on soccer footage; the foundation model itself is unchanged.
Path A — From scratch. Train a same-size vision transformer from randomly initialized weights, only on soccer video. No general-purpose pretraining.
Floor — Random initialization. No training at all — random features. The performance floor that shows the eval isn’t trivial to game.
All training uses the same self-supervised objective — a recent method called LeJEPA that combines a covariance regularizer with an invariance loss across different crops of the same image. Using one unified objective across all training arms removes a major confound; differences in transfer reflect initialization choice and training budget, not differences in what we’re optimizing.
03 · How the model goes from pixels to an answer
Both downstream tasks share the same backbone. The only thing that differs between “basketball mask” and “soccer action” is the tiny readout at the very end.
- Tile. Cut the 224×224 frame into a 14×14 grid of 16×16-pixel tiles (196 tiles total).
- Embed. Project + position-encode each tile. Each tile’s 768 raw RGB values → 384-dim vector; add positional info.
- Attention (×12 layers). Transformer backbone. In each layer, every tile attends to every other tile, integrating context. After 12 rounds, each tile’s vector encodes local content + global scene. This is what pretraining trains. Shared across all downstream tasks.
- Tile features. 196 tile features, 384 numbers each. What we do with them depends on the task.
- Task-specific readout.
- Mask (basketball). Per-tile readout: keep all 196 tile features separate. For each tile, a tiny linear classifier outputs ; threshold at 0.5 to get a 14×14 mask.
- Class (soccer). Pooled readout: average all 196 tile features into a single 384-dim vector; a 17-way classifier scores each action (throw-in, foul, corner, goal, …).
The probes in step 5 are tiny: a single linear layer each. The hard work — and what pretraining trains — is the backbone (steps 2–3). Whether a model is “good for sports” is really a question about whether those tile features carry the right signal.
Two things worth pulling out:
- The probe is tiny; the backbone is doing the work. When frozen DINOv3 scores 0.671 IoU on basketball, that score reflects how good DINOv3’s pretrained backbone is at producing tile features — a single linear layer picks out the player tiles from those features. We never trained DINOv3 on basketball. That a linear readout works at all is what makes something a “foundation model.”
- Same backbone, two different output shapes. The basketball model and the soccer model use the same backbone weights — only step 5 differs. That’s why we can ask one model two very different questions and compare results fairly.
DINOv3 vs. what we trained
The backbone in step 3 is what varies between the four configurations we compare. Two of them are reference points; two are models we actually trained. Organized by where the backbone weights start and what we changed during training:
| Starts from random weights | Starts from DINOv3 weights | |
|---|---|---|
| No further training | Reference · floor — Random initialization. 22 M parameters drawn from a random distribution. The lower bound. | Reference · bar — Frozen DINOv3. Meta AI’s pretrained foundation model. Off-the-shelf; we never trained it on sports. The bar to beat. |
| Trained on soccer SSL | Ours · Path A — From scratch. All 22 M parameters trained on 300 hours of soccer video. No foundation-model help at all. | Ours · Path B — DINOv3 + adapter. Weights frozen, small LoRA adapter trained on soccer. Roughly 0.6 M new params out of 22 M. Foundation preserved, lightly adapted. |
Whenever we say “our pretrained model”, we mean Path A or Path B. DINOv3 itself is Meta’s foundation model that we did not modify — it just sits in the study as the strongest reference we could plausibly hope to match.
Scale context. Same model size, very different pretraining diets. Every cell above uses the same architecture — a 22-million-parameter vision transformer (ViT-S/16). What varies is what the model has seen. DINOv3 was pretrained on roughly 1.7 billion general internet images. Our from-scratch model was pretrained on roughly 265,000 soccer-broadcast frames — about 6,500× less data, all from one narrow visual domain. So the architecture is matched; the diet absolutely isn’t.
You might also wonder why we pretrained on soccer and tested on basketball rather than the other way around. The reason is data scale. The basketball evaluation dataset (DeepSportRadar) has only 728 annotated samples — orders of magnitude too small to train a vision transformer from scratch. Soccer is where the unlabeled video is; basketball, in this study, is purely an out-of-domain evaluator.
04 · What the numbers actually measure
Two numbers do most of the work in this project. Both have real, concrete meaning — we built visualizations to make that meaning obvious.
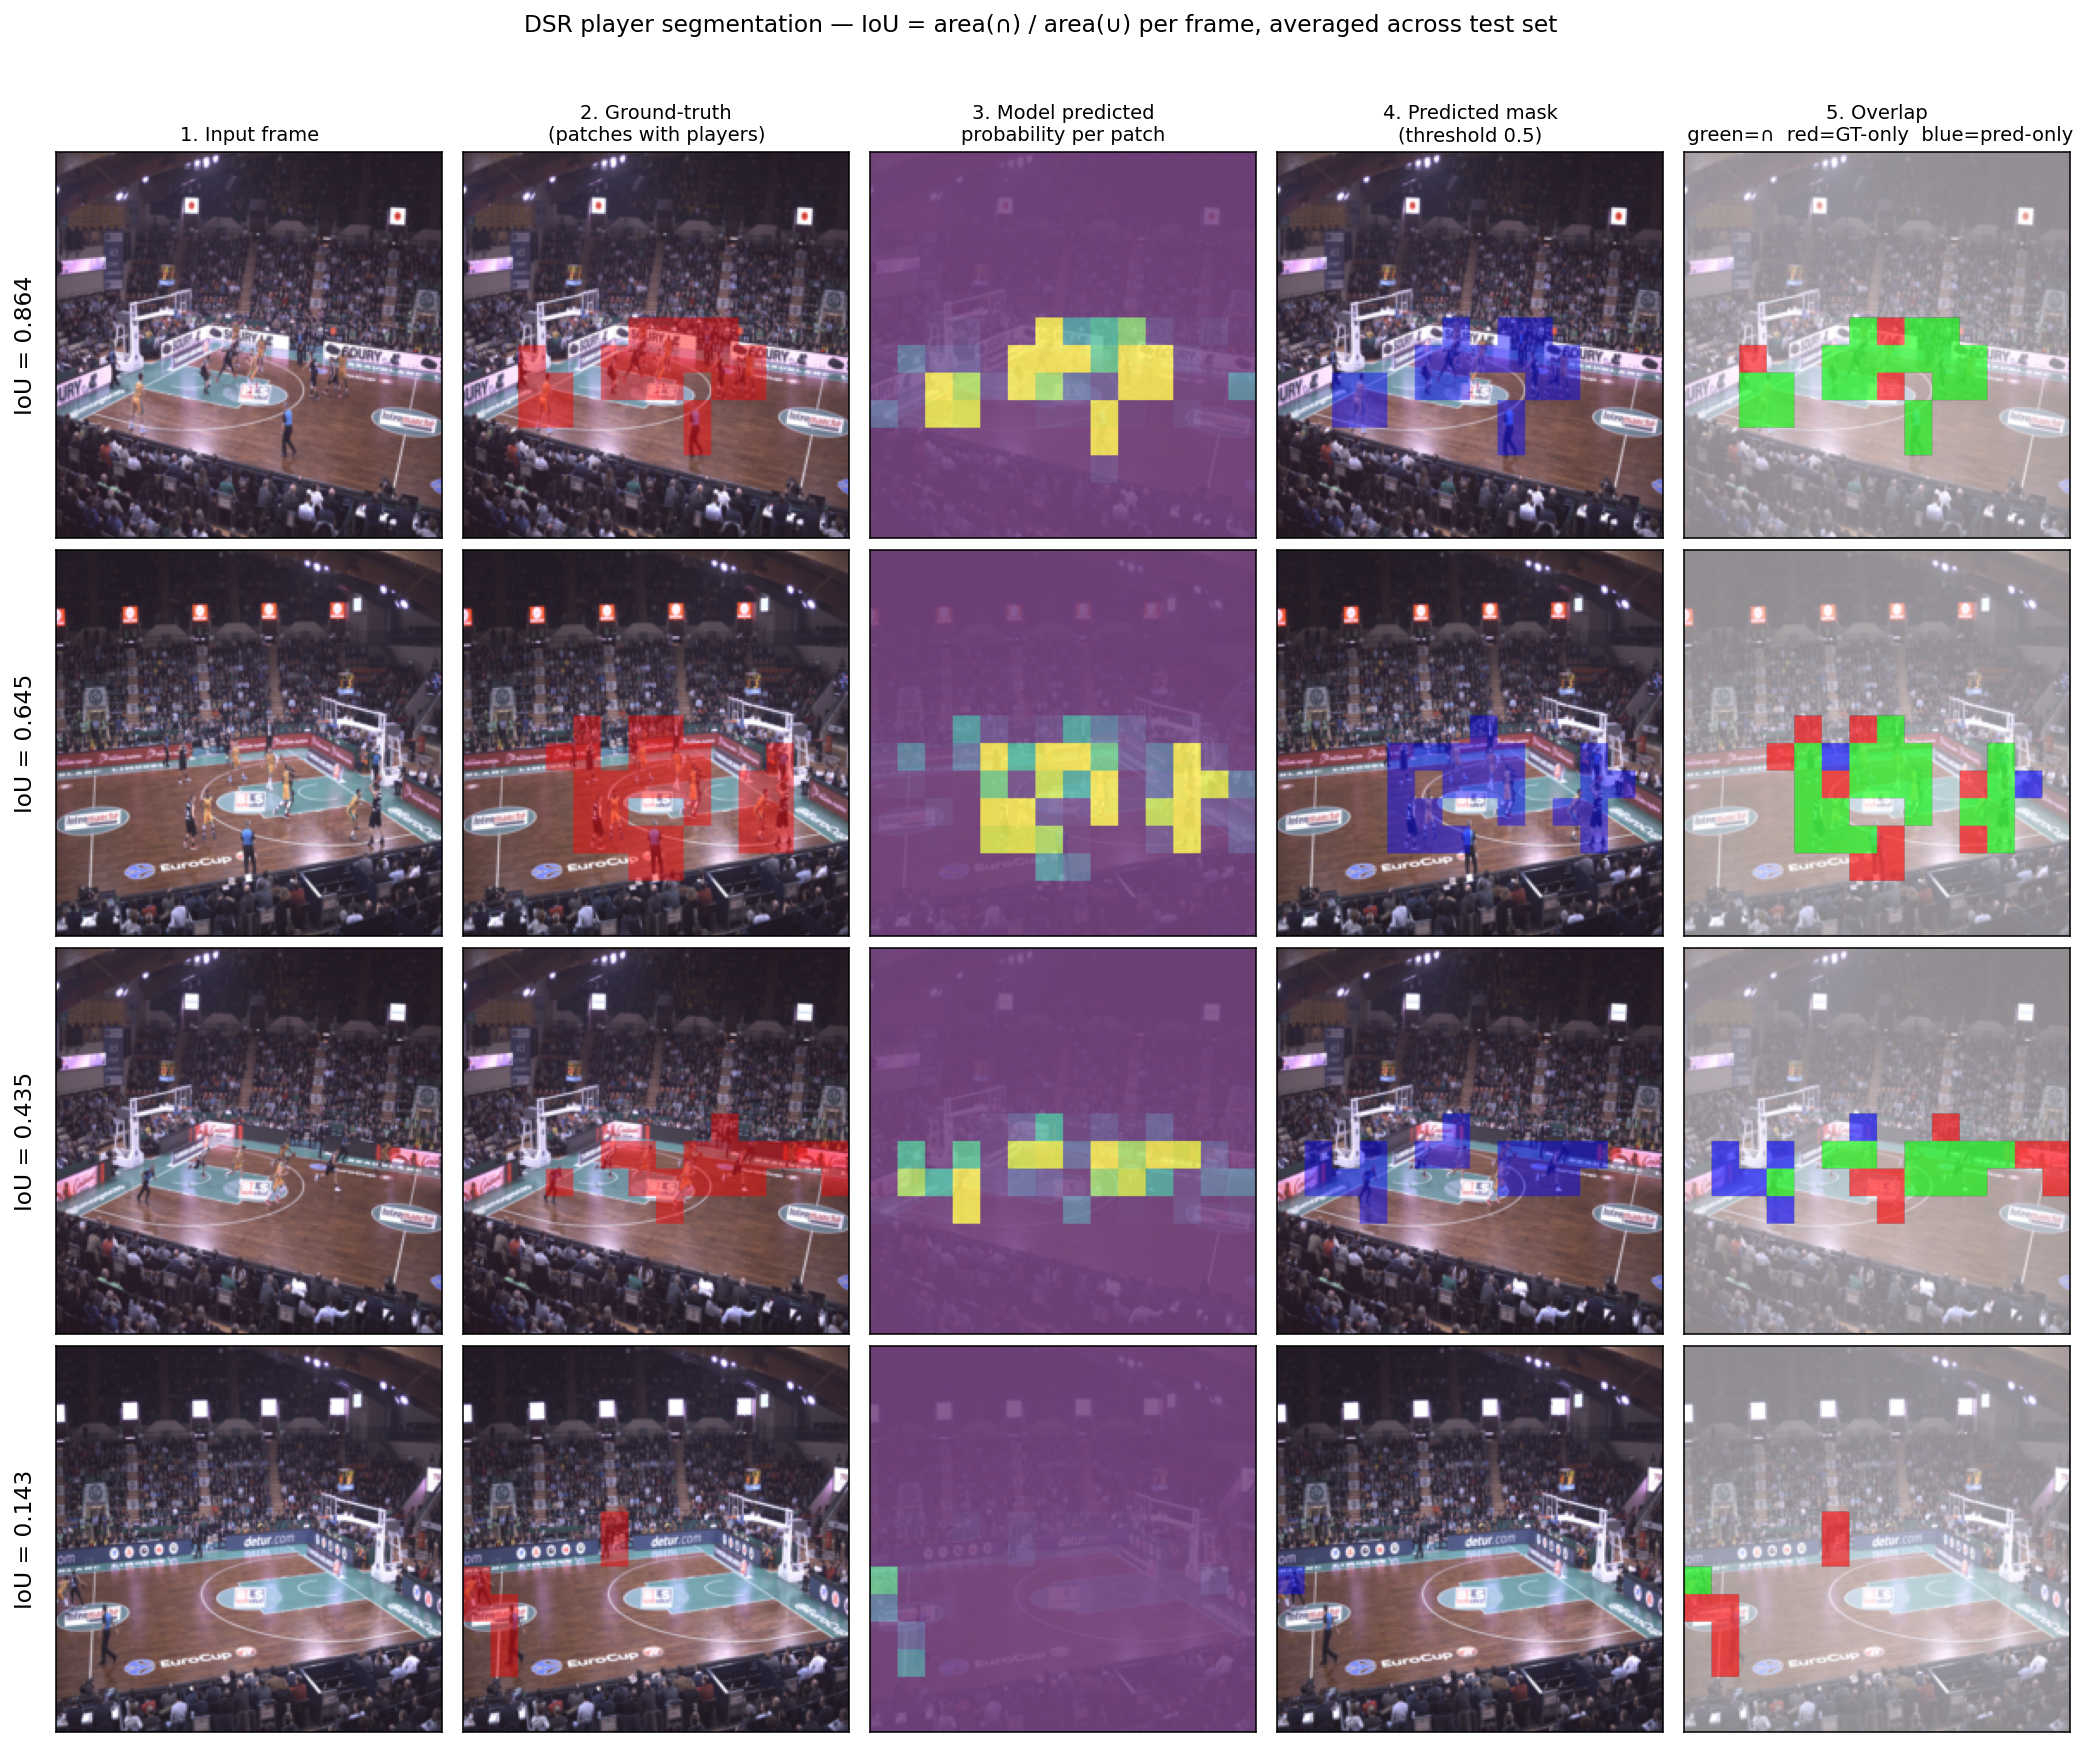
Basketball player segmentation — Intersection-over-Union (IoU)
For each test frame, the model labels every 16×16 pixel patch as “contains a player” or “doesn’t.” The Intersection-over-Union score is the overlap between the predicted player region and the ground-truth player region, divided by their combined area:
A score of 1.0 means perfect overlap; 0 means no overlap. We average across 84 held-out test frames from three basketball venues never seen during training.
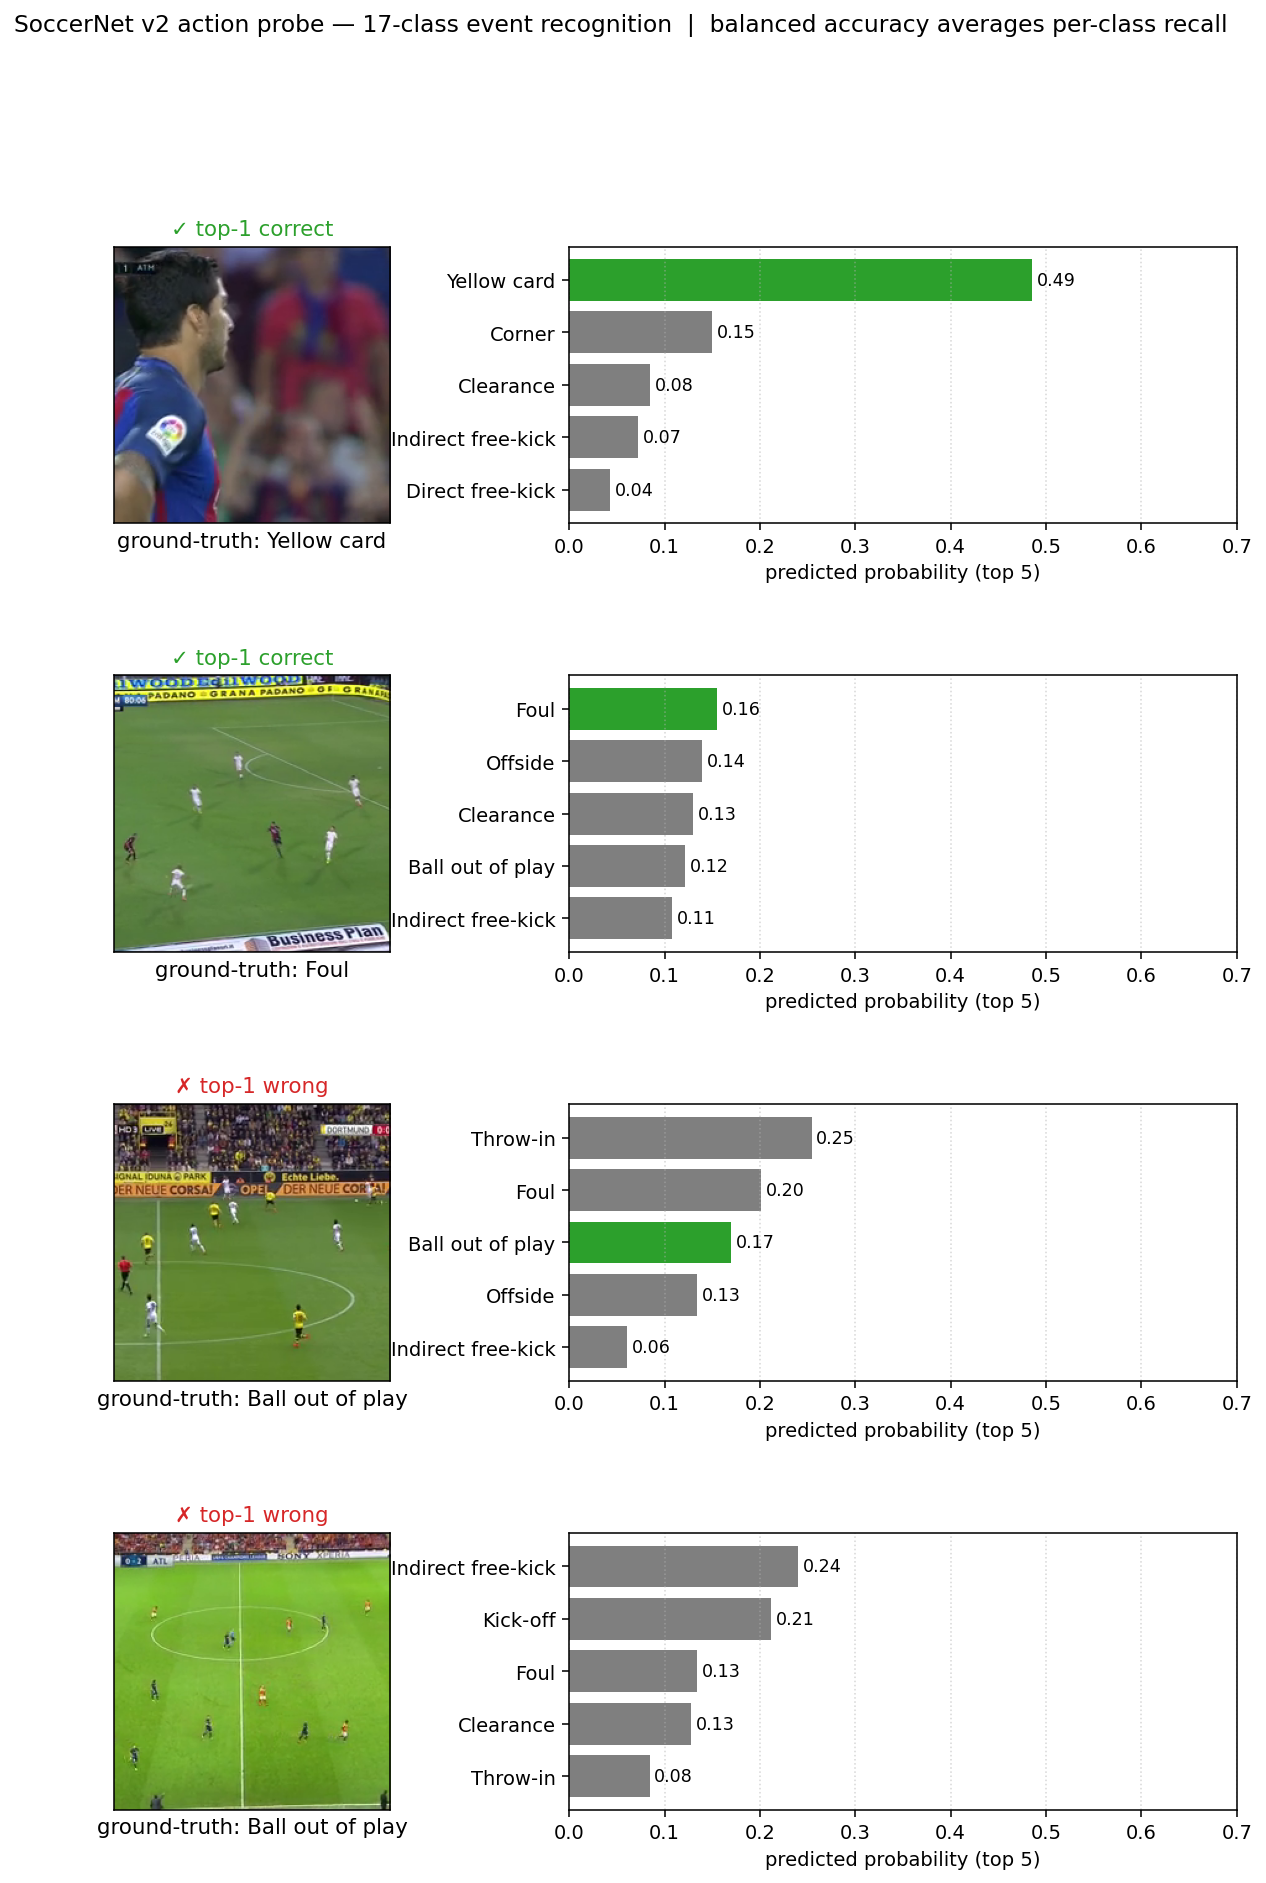
Soccer action recognition — balanced accuracy
For each annotated event frame in held-out soccer games, the model predicts which of 17 action types is happening (throw-in, foul, goal, etc.). Balanced accuracy is the model’s success rate averaged across all 17 classes — so getting rare events like “penalty” right counts as much as getting common events like “ball out of play” right. Chance performance is 5.9% (1 in 17).
Why two evaluators? Basketball IoU and soccer balanced accuracy capture different things. Basketball is a dense spatial task on a small held-out set (84 frames): sensitive to whether features can locate “what a person looks like” in pixels. Soccer is a semantic classification task on a large held-out set (171,000 events): sensitive to whether features can distinguish “what kind of soccer moment this is.” The two evaluators stress different parts of the feature space.
05 · What we found
The scorecard — results across all configurations
Each row below is a single trained model. We measured the same model on both downstream tasks. The reference points: frozen DINOv3 (no additional training) and a random-initialized vision transformer of the same size.
| Model | Training steps | Basketball IoU | Soccer accuracy |
|---|---|---|---|
| Random init (no training) | — | 0.192 | ~0.06 (chance) |
| Frozen DINOv3 (reference) | — | 0.671 | 0.282 |
| DINOv3 + LoRA adapter | 10,000 | 0.704 (+0.033) | 0.294 (+0.012) |
| DINOv3 + LoRA adapter | 30,000 | 0.662 (−0.009) | 0.295 (+0.012) |
| DINOv3 + LoRA adapter | 100,000 | 0.672 (+0.001) | 0.288 (+0.006) |
| From scratch (single-crop) | 10,000 | 0.298 | 0.193 |
| From scratch (single-crop) | 50,000 | 0.375 (mean of 2 seeds) | 0.222 |
| From scratch (multi-crop V=6) | 33,000 | 0.353 (mean of 2 seeds) | 0.241 |
| From scratch (single-crop, clipped) | 100,000 | 0.373 (mean of 2 seeds) | 0.244 |
| From scratch (multi-crop V=6, clipped) · composition probe | 100,000 | 0.395 (1 seed) | 0.252 (1 seed) |
Three findings stand out.
1. The lightweight adapter gives a small but real bump — and that’s the ceiling
DINOv3 with a low-rank adapter trained for about 10,000 steps gives a +0.033 IoU bump on basketball (about 5% relative over the frozen baseline) and +0.012 balanced accuracy on soccer. The bump is real and reproduces across configurations. What it isn’t: a stepping stone to bigger gains. Training the adapter longer (30k, 100k steps) walks the score around the frozen baseline without meaningfully exceeding it.
2. From-scratch SSL nearly matches the foundation model in-domain — but lags it cross-domain
The story splits sharply depending on whether you stay in-domain (pretrain on soccer, apply on soccer) or cross over (pretrain on soccer, apply on basketball).
| Setting | Frozen DINOv3 | Our best from-scratch model | DINOv3’s edge |
|---|---|---|---|
| In-domain · soccer action recognition | 0.282 | 0.252 | ~11% relative |
| Cross-domain · basketball player segmentation | 0.671 | 0.395 | ~41% relative |
Best from-scratch model in each row is our composition probe (multi-crop V=6 + 100,000 steps + gradient clipping), single seed. Soccer balanced-accuracy is highly seed-stable across our runs (±0.005); basketball IoU is noisier (±0.06) so the single-seed cross-domain number should be read as roughly in the same band as the other Path A configurations we tested.
On the in-domain task, a model trained from random weights on 300 hours of soccer comes within about 11% of a foundation model trained on a billion-plus general images. That’s a genuinely strong result. With more soccer data or a larger model, the remaining gap looks closeable.
On the cross-domain task — applying a soccer-trained model to basketball — DINOv3’s breadth dominates: features learned across a billion-plus everyday images generalize to basketball much better than features specialized for soccer broadcasts. From-scratch SSL closes only about a third of that gap.
Practical reading: from-scratch in-domain SSL is a viable path when you have plentiful unlabeled in-domain data and your deployment stays in that domain. Foundation models still win for cross-domain transfer and for the general case where you don’t know in advance what you’ll be deploying on.
3. Data volume barely matters; data diversity probably does
We compared pretraining on 32,000 soccer frames versus 265,000 soccer frames at the same step budget. The results came in essentially identical (~0.704 IoU either way). Eight times more data of the same kind contributed nothing measurable to transfer. The bottleneck for further gains on this kind of task is probably the visual diversity of the pretraining corpus, not raw volume.
06 · The lessons that weren’t in the plan
Three meta-lessons from running this study that we think generalize beyond sport-transfer specifically.
Don’t extrapolate a transfer curve from two points
Earlier in this project we ran the LoRA adapter at 10,000 and 30,000 steps. The 30k score was lower than the 10k score, and we tentatively read this as “extended pretraining destroys cross-domain transfer.” The 100k score landed back near the 10k score — the curve is non-monotone, not catastrophic. The model wasn’t being destroyed; it was being transiently disrupted and then re-equilibrating. The original two-point story would have been a confident-but-wrong finding.
Distinguish recipe failures from real findings before concluding anything
Our first from-scratch model trained for 100,000 steps gave a surprisingly bad score: 0.183 IoU on basketball — worse than the same recipe at 50,000 steps. The natural reading was “longer training hurts.” But the training curve showed a clear loss spike around step 60,000 that never fully recovered, and the model’s weights had drifted 2.6× further from their starting point than the 50k model. We added a standard remedy (gradient clipping, which limits how aggressively the model can update in any single step) and re-ran: the new 100k model came back to within seed-noise of the 50k model. The original “longer is worse” reading was a training instability sold as a finding.
Lesson: When a downstream number drops unexpectedly, check the training-time diagnostics — loss trajectory, weight norm growth — before treating the drop as a real signal. The fix may be a recipe change, not a hypothesis change.
The size of the test set matters as much as the model
Once we ran each from-scratch configuration with two random seeds instead of one, basketball scores moved by up to ±0.06 IoU just from different initial weights. The same configurations on soccer moved by only ±0.005. The gap is statistical: 84 basketball test frames versus 171,000 soccer events. Small held-out sets in transfer benchmarks produce noisy rankings; reporting any single-seed ranking from a small test set without multi-seed bars overstates the certainty of the result. This changed how we read our own scorecard.
Lesson: A held-out test set’s size is part of its evaluator power. Methods compared on small benchmarks can produce rank-orders that flip with the next random seed. Always run multiple seeds before announcing a winner — and prefer larger evaluators where you can.
07 · Open questions
The honest answer to “is more SSL pretraining worth it?” depends on what you’re trying to do. For cross-domain transfer, foundation models are still the right call. For in-domain deployment with abundant unlabeled data, from-scratch SSL is a real option that gets you within striking distance of foundation-model quality without needing access to one. There are three concrete follow-ons we’d pursue with more time and compute to firm up that picture:
- Multi-sport pretraining corpus. If the bottleneck is visual diversity rather than data volume, combining soccer, basketball, tennis, hockey, etc. into one pretraining corpus should materially help. The hardest part is acquisition.
- Proper multi-resolution multi-crop. Our multi-crop experiments used same-resolution crops; the standard SSL recipe (DINO-style) uses 2 global 224×224 crops plus 6 small 96×96 crops, which is far cheaper per step and shows up consistently in the literature. Worth a careful comparison.
- Bigger from-scratch model. Our scratch model was small (22 M parameters). Capacity is a known knob; an 86 M-parameter from-scratch model would close more of the gap — but probably not all of it, and the foundation-model recipe gets compute savings on top.
Research conducted over one week on four NVIDIA RTX 5090 GPUs. Numbers shown are absolute scores from held-out evaluation; multi-seed where indicated. Builds on open work by the DINOv3 team at Meta AI, the SoccerNet consortium, the DeepSportRadar team, and the authors of LeJEPA. Thanks to all of them.
Ugg have giant brain. Brain look at billion pictures from internet. Brain very smart, see many things.
Question: if Ugg teach brain extra about soccer, brain get smarter at sport? Or brain already smart enough?
Ugg try four brains:
- Big smart brain alone (already good)
- Big smart brain plus tiny soccer hat on top
- Fresh empty brain, only watch soccer
- Random brain that learn nothing (just for compare)
Then Ugg make brains do two jobs: find basketball players in picture, and guess what happening in soccer game.
What Ugg find:
Tiny soccer hat on smart brain — help little bit. Not lot. Just nudge.
Fresh soccer-only brain — get close to big brain at soccer stuff! Almost as good. But show fresh brain basketball? Fresh brain bad. Only know soccer. Big brain win at basketball because big brain saw many many things, not just soccer.
Feed brain 8 times more soccer pictures? No help. All soccer look same. Brain need different kinds of pictures, not more of same picture.
Big lessons Ugg learn:
Two dots not make line. Ugg saw brain go down at one point, think “uh oh, more training bad!” But Ugg check third dot — brain come back up. Was just bumpy road, not broken brain.
Sometimes brain look bad but really just had hiccup in training. Check inside before yell “discovery!” One time Ugg add small fix and bad brain become good brain. Was not real finding, just training boo-boo.
Small test = noisy answer. Basketball test only 84 pictures. Same brain different start = scores wiggle lot. Soccer test had 171,000 — much steadier. Tiny tests lie to you. Always run many times, never trust just one.
Big idea: if you do one thing forever, you get good at that one thing. If you want to be good at many things, see many things.